Inside Edge 2025 MLB Catcher Blocking Report

Knee-down catching is the new norm across Major League Baseball now. It works, not just for pitch framing, but for pitch blocking as well.

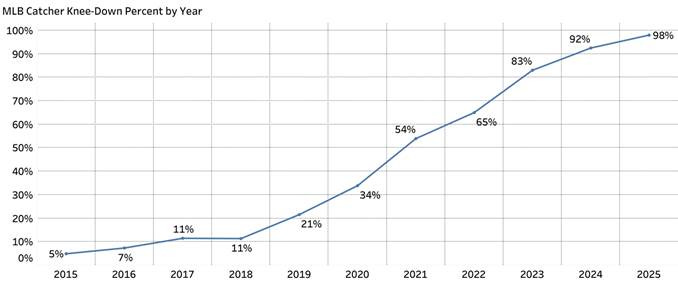
The 2025 MLB season was the culmination of a gradual increase in knee-down catching over the last decade. Only 5% of pitches caught during the 2015 MLB season were in a knee-down stance. 2019 marked the beginning of the shift towards this new trend, showing a 10% increase from 2018. By 2025, over 97% of pitches were caught from the knee-down stance.

27,933 block attempts were taken by catchers in the knee-down stance during the 2025 season, compared to the 782 attempts taken in the traditional squatting stance. And despite the disparity in sample size, the knee-down stance graded out 0.65 percentage points better, with a 94.38% block rate compared to 93.73% for the traditional stance.

While this may be considered a marginal difference to some, this validates the efficacy of knee-down catching for not only pitch framing, but pitch blocking as well. Many critics of the stance believed that the overemphasis on framing would result in more passed balls and wild pitches, yet this has also been debunked by recent data findings.

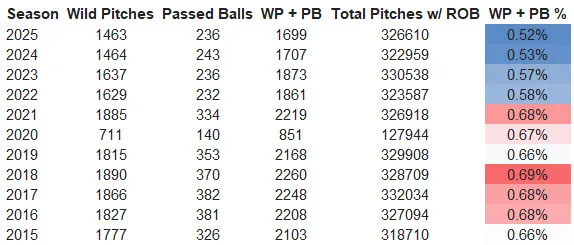
In 2025, 326,610 pitches were thrown with runners on base. Of those pitches, 1,699 resulted in wild pitches or passed balls, for a rate of 0.52%. This was the lowest rate of the StatCast era, beginning in 2015.

Overall (all pitches with runners on base)

Catchers posted a 2.78% wild pitch and passed ball rate in the 2025 season, allowing 1,074 wild pitches and passed balls among 38,594 balls in the dirt with runners on base. This was the second-lowest rate of the StatCast era, trailing only the 2024 season.

Balls in dirt with runners on base

It would be disingenuous to say that the decrease in wild pitches and passed balls is entirely attributed to the knee-down stance. However, the argument that teams have prioritized pitch framing at the expense of blocking doesn’t have much credence when blocking, passed balls, and wild pitches are at the best rates they’ve been over the last decade. Marginal improvements are all it takes for trends to become the norm in baseball, and the one-knee stance is here to stay.

Who were the best blocking catchers in 2025? Yohel Pozo (98.45% block percentage), Hayden Senger (98.22%), and Sandy Leon (97.57%) were the three best blocking catchers in the Majors in 2025. Pozo and Senger were particularly excellent, as they were the only two in the top six with at least 100 block attempts.

Top 20 Catchers (Shrunk Block %)

* Shrunken % uses a Bayesian prior of 15 attempts at league average. 95% confidence intervals shown on catcher rankings.

Endy Rodriguez (84.67%), Gary Sanchez (87.44%), and Samuel Basallo (88.55%) were the three biggest underperformers in blocking during the 2025 season. Sanchez and Basallo’s performances were particularly underwhelming, as both logged in at least 100 block attempts. Micky Gasper was not far behind them either, with an 88.85 shrunk-block% across 100 block attempts.

Bottom 20 Catchers (Shrunk Block %)

* Shrunken % uses a Bayesian prior of 15 attempts at league average. 95% confidence intervals shown on catcher rankings.

2025 World Series – A Look Into Championship Win Probability Added

Saying the 2025 World Series was the best series of baseball ever seen might not be too far from the truth. While the season is over, it is hard not to think about every little minuscule detail about the final games, final moments, and final pitches in this 7-game classic.

Before we get into the 2025 World Series, let’s take a look at what Championship Win Probability Added (cWPA) is. cWPA calculates the increase in probability of winning the World Series. For example, when Bill Mazeroski hit his historic walk off home run in Game 7 of the 1960 World Series, he added 36.7% cWPA in a single swing. cWPA takes into account all events that change the win probability in a given game and then they are added up. If a game is 7-0 after the top of the 1st inning and the pitcher throws a no-hitter, that would be a very low win probability added game. A good example of that is Game 3 of the 1960 World Series. The Yankees scored six runs in the first inning and four more in the fourth. The Pirates totaled just four hits in the game. Below is the chart from Baseball Reference showing the win probability for the Yankees and Pirates in that game.

How about we look at a game with a high cWPA? Below is the win probability chart for Game 6 of the 2011 World Series. We see a lot of peaks and valleys with a lot of shifts with a high win probability for the Rangers and then the Cardinals (and David Freese). This game was the 9th highest cWPA in all of history.

The 2025 World Series had the highest cWPA of any World Series in history. We saw 57 plays in the seven games that shifted the win probability at least five percentage points, most in any World Series. We have labeled those plays with a cWPA of at least 5% as ‘Big Plays’.

Two reasons why this World Series accounted for the most cWPA in history is the back and forth affair in Game 7 and the 18-inning stalemate in Game 3. Game 7 is the 2nd highest cWPA in World Series history and Game 3 is the 13th highest.

When it comes to an individual, Yoshinobu Yamamoto had one of the all time World Series runs. He recorded three wins in the World Series and pitched in back-to-back games, something rarely done after throwing 90 pitches the day prior. He recorded the 4th best cWPA ever and joined Madison Bumgarner as the only other pitch this century with a cWPA over 50%.

We’ve talked about the series, the games, and the players. Now, it is time to look at the biggest moments in Game 7 and where they rank all time. Game 7 in 2025 has three of the top-10 highest cWPA moments in World Series history. The final double play to end Game 7 ranks as the 4th highest cWPA and the Will Smith solo home run to give the Dodgers the lead is right behind it. Miguel Rojas’ solo home run to tie the game with one out in the 9th inning comes in as the 10th highest cWPA in World Series history.

Offense+ Defense EPA Per Play

We are back to take a look at some EPA numbers entering Week 10. Let’s start with the defensive side of the ball.

  • The Chargers defense has allowed just 10 touchdowns all season, best in NFL. They allow successful plays on just 37.6% of plays, 4th best in NFL. They start strong with a 33.2% successful play rate allowed in the 1st half, best in NFL.
  • There are no two ways about it, the Broncos defense got crushed last week. Despite that, they are allowed first downs on just 25.0% of plays this year, T-best in NFL. They have the best sack rate (10.2%) on first down which makes it quite difficult for opposing offenses to convert. In fact, they’ve forced three and outs on 28.8% of opposing drives, 5th best in NFL.
  • The Jets and Browns allow a bit more on the explosive side compared to the successful side this season. The Jets are allowing a 60.2% reception rate, 2nd best in NFL. The Browns (and Titans) have allowed the most 20+ yards rushes (12) this season.

Let’s take a look at the offensive side of the ball.

  • The Chiefs don’t necessarily feel explosive and the chart reflects that. Where are they special? 3rd down. Mahomes is averaging 0.36 EPA per pass play on 3rd down and they are converting 53.2% of 3rd downs this season, both best in NFL.
  • Baltimore might be the most explosive team this season. They have 7 or more explosive plays in ALL of their games this season, best in NFL. On the other hand, the Commanders have 6 games where they have 7+ explosive plays and they have won all of those games.
  • The Buffalo Bills have been less successful on a per play basis but they have a couple of standout numbers. They average 0.28 EPA per play on motion plays and they (and the Commanders) are perfect on their 4th down tries this season.

What else stands out from the numbers above? Where is your team successful or lacking success?

Week 4 EPA Notes + Remarkable Notes

It was a dominant showing for many teams in Week 4 but let’s start with the Rookie of the Year front runner, Jayden Daniels. As a rookie, he has the 4th best EPA per dropback through four weeks. The mistakes have been few and far between for the Washington QB. Joe Flacco enters this list at the number five spot after coming on after an Anthony Richardson injury. The Dolphins are currently dealing with a QB problem that hopefully gets eradicated once Tua Tagovailoa is cleared to come back to play from IR.

Jayden Daniels is atop top EPA per rushing leaderboards but there are a trio of running backs that crushed their opportunities in Week 4. Derrick Henry, Kenneth Walker, and Jahmyr Gibbs lead the way as the top three backs four games into the season. Rookie Bucky Irving slots in at the 6th overall slot and 4th best RB on an attempt basis.

The Fields to Pickens relationship has gone well for Steelers in the early part of the season. Brian Thomas is the first rookie on the list but Malik Nabers is only a couple of spots behind with twice (!) the targets.

What else sticks out from these lists? Let’s take a look at some Remarkable notes from the 2024 season.

  • Lamar Jackson (BAL) has averaged 0.26 epa per play on passing attempts on Early Downs this season — best of 33 qualified NFL QBs; League Avg: 0.01.
  • Brock Purdy (SF) has 18 completions for 20+ yards this season — most among NFL QBs.
  • Josh Allen (BUF) has a passer rating of 104.7 when under pressure (11 Pass Attempts) this season — best of 28 qualified NFL QBs; League Avg: 55.0.
  • The Chiefs have scored on 71% of their drives in the 3rd quarter this season — best in NFL; League Avg: 30%.
  • The Bears have run none of their plays in the red zone in the 1st quarter this season — worst in NFL; League Avg: 13%.
  • The Broncos defense has allowed successful plays on 34% of plays on motion plays this season — best in NFL; League Avg: 44%.
  • The Ravens defense has allowed rushes of 10+ yards on just 1 of 74 carries (1%) this season — best in NFL; League Avg: 12%.
  • Sam Darnold (MIN) has averaged 0.23 epa per play on passing attempts this season — best of 33 qualified NFL QBs; League Avg: -0.03.
  • Derrick Henry (BAL) has broken 11 tackles this season — most among NFL RBs.
  • Kenneth Walker (SEA) has averaged 0.41 epa per play on rushing attempts in the 2nd half this season — best of 34 qualified NFL RBs; League Avg: -0.04
  • Nico Collins (HOU) has 25 first down receptions this season — most among NFL WRs.

Week 3 EPA Notes + Remarkable Insights

We are three weeks into the NFL season and there are five teams still with a perfect record. The Bills have re-inserted themselves into the Super Bowl conversation while Sam Darnold and the Vikings continues to crush on the offense. Let’s take a look at those QBs and the best ones by EPA per dropback this season.

If you could crown a MVP in Week 3 of the season, it would go to Josh Allen. Similarly, Jayden Daniels would be awarded rookie of the year, especially after his performance against the Bengals. Caleb Williams is off to a slow start with the Bears and Trevor Lawrence is hoping (and expecting) a big turnaround sooner rather than later. Who will fall on this list and who will rise by the end of the season?

How much are your players adding when being targets this season? Well after Jauan Jennings performance Sunday afternoon, he leads the NFL in EPA per target. While he might not stay atop the list, the 49ers still have the ability to be efficient without their best weapons.

De’Von Achane is the first running back on the list and brings a great receiving option out of the backfield in Miami.

It is always interesting to see that three quarterbacks lead the league in EPA per rushing attempt, but here we are. J.K. Dobbins is the first non-QB on the list and his efficiency behind that Chargers line is something to behold. The Lions RBs are in a great position and Derrick Henry charges up the leaderboards after having a monster day against the Dallas Cowboys.

What are some thing you noticed on the leaderboard this week?

Let’s take a look at some Remarkable notes to start the 2024 NFL season:

  • The Commanders have scored on 64% of their drives this season — best in NFL; League Avg: 38%.
  • The Dolphins have scored on 21% of their drives this season — worst in NFL; League Avg: 38%.
  • The Bills are averaging 2.4 drives per TD this season — best Drives Per TD rate in NFL; League Avg: 5.0.
  • The Bills defense has allowed a passer rating of just 24.9 first read passes (31 Pass Attempts) this season — best in NFL; League Avg: 91.4.
  • The Bills have averaged 0.76 epa per play on first read passes this season — best in NFL; League Avg: 0.17.
  • The Cardinals have averaged 0.54 epa per play on first drive of the game this season — best in NFL; League Avg: 0.01.
  • The Titans defense have allowed -0.43 epa per play against play action passes this season — best in NFL; League Avg: 0.04.
  • The Saints defense have allowed -0.31 epa per play with a base rush this season — best in NFL; League Avg: -0.05.
  • Josh Allen (BUF) has averaged 0.44 epa per play on passing attempts this season — best of 35 qualified NFL QBs; League Avg: -0.04.
  • Andy Dalton (CAR) has averaged 0.27 epa per play on passing attempts on Early Downs this season — best of 34 qualified NFL QBs; League Avg: 0.01.
  • Sam Darnold (MIN) has averaged 0.99 epa per play on passing attempts on passes to the middle of the field this season — best of 28 qualified NFL QBs; League Avg: 0.05.
  • Alec Pierce (IND) has averaged 18.8 yards per target (225 yards/12 targets) this season — best of 77 qualified NFL WRs; League Avg: 7.8.
  • The Packers defense has intercepted 7 of 102 attempts (14.6 pass attempts per int.) this season — best in NFL; League Avg: 43.2.

NFL Success Rate – Week 1

Week 1 of the 2024 NFL Season was everything we could’ve hoped for as fans. We had upsets, shootouts, stout defensive battles, and lots of big plays. Some teams shined in their introductory performance to the 2024 Regular Season, while others have shown that they have lots of room for improvement. To quantify which teams had the most “success”, we can categorize any given play as “successful” or unsuccessful” via the below criteria:

  • 1st Down Plays: Gains of at least 50% of yards required for new set of downs
  • 2nd Down Plays: Gains of at least 70% of remaining yards required for new set of downs
  • 3rd and 4th Down Plays: Gains of at 100% of yards required for new set of downs (conversions only)

All touchdowns considered successful, all turnovers considered unsuccessful

Plays called back due to penalty not included

**Week 1 League Average Success Rate: 48.27%

In terms of Net Success Rate (A teams’ offensive success rate – defensive success rate), the New Orleans Saints had the most impressive win of Week 1. In their 47-10 domination over the Carolina Panthers, the Saints totaled a Net Success Rate of approximately 0.2 – as their offense performed a successful play on 58% of snaps while their defense allowed a successful play on just 38% of snaps. Not far behind was the Seattle Seahawks with a net success rate of 0.19 in their 26-20 win over the Denver Broncos. Of all losing teams (shown in blue below), the Cincinnati Bengals had the best net success rate of the bunch at 0.04 in their upset loss to the New England Patriots.

In the below graphic, we can see how each team compared offensively versus defensively. Teams with their logo displayed on the right hand side had an above average offense, while teams on the bottom half had an above average defense. The teams with the best overall performances can be seen in the bottom right quadrant while the teams that lacked success in Week 1 can be found in the top left.

The top offensive success rate of the week was 65.6% from the Detroit Lions in their 26-20 OT victory over the Los Angeles Rams. This came from their consistency in the running game, as they were able to average 5.3 yards per carry despite their longest run totaling only 21 yards. The top defensive success rate of the week came from the Dallas Cowboys, as they held the Cleveland Browns to a successful play on less than 32% of their snaps. Specifically, the Cowboys’ pass defense was stifling, allowing only 3.8 yards per pass attempt to go along with their 6 QB sacks.


How successful was your team in Week 1?